Monitoring Splunk Connectivity to Jira Server
- Kara Born
Prerequisites
Checking Splunk Connectivity in Jira
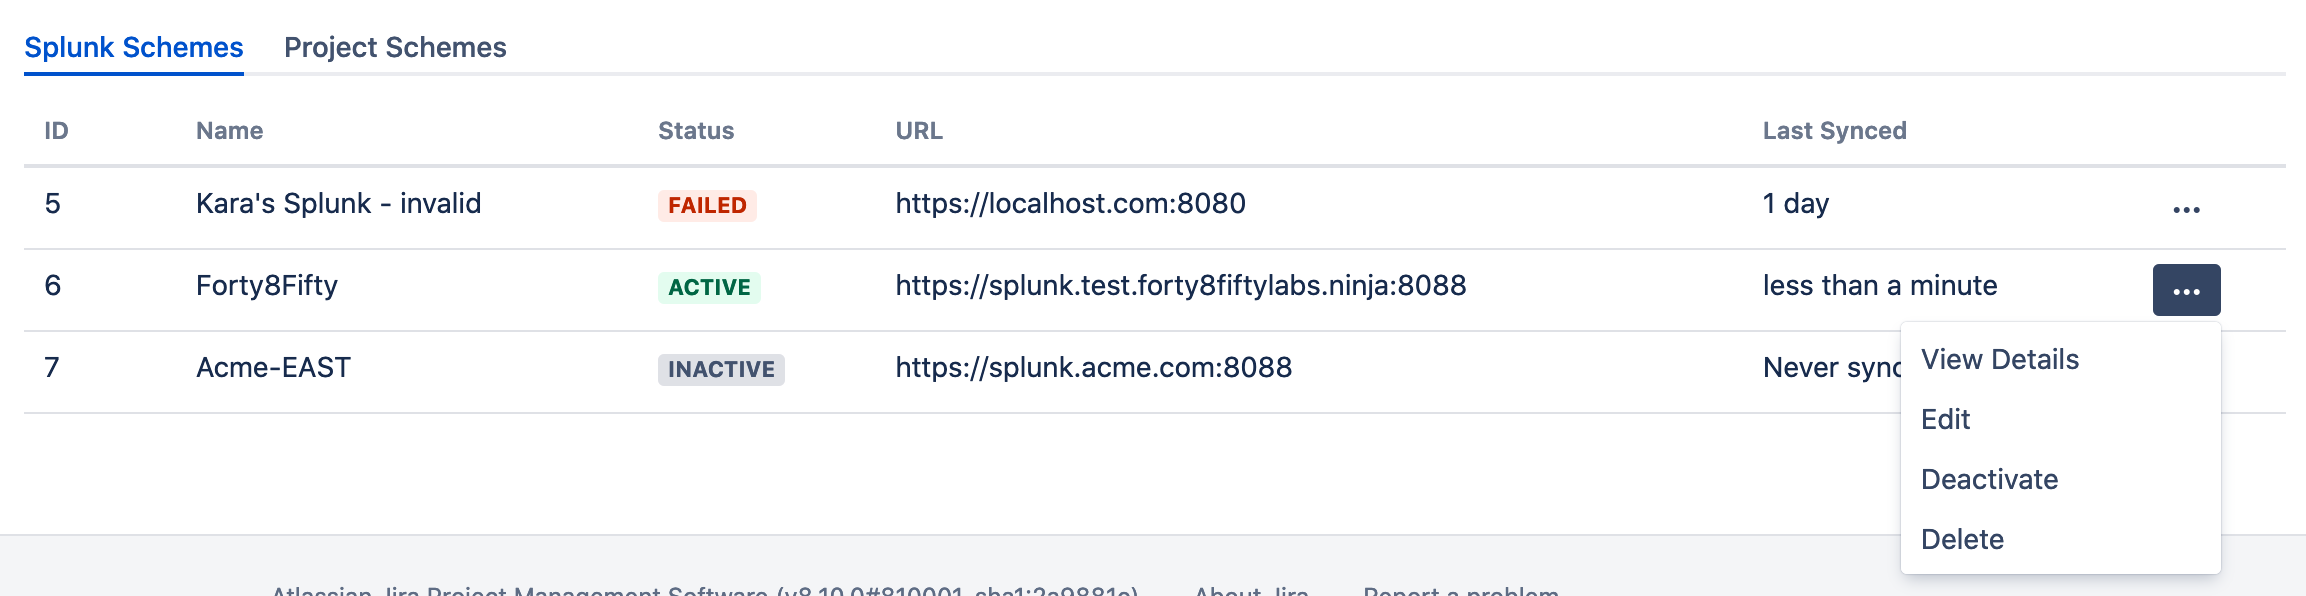
The add-on automatically checks the connectivity of your Splunk servers every 2 minutes, by default. You can view the current status and time since the last sync on the Jira configuration page for the add-on.
- Click the gear icon, and then click Applications.
Under Integrations, click RealTime Splunk for Jira.
- Click the Splunk Schemes tab.
For each server, the table shows the results of the most recent connectivity check and the reason for a failure, if applicable. To modify or remove a Splunk server connection, click the ellipses, and then click Edit or Delete.
The add-on verifies the Splunk URL before activating the connection. If you receive an error message about the Splunk URL, correct the settings and then activate the Splunk server.
Changing the Settings for Connectivity Checks
You can change the default values for the frequency of connectivity checks and other communication settings between Jira and Splunk.
- Click the gear icon, and then click Applications.
Under Integrations, click RealTime Splunk for Jira.
- Click Settings.
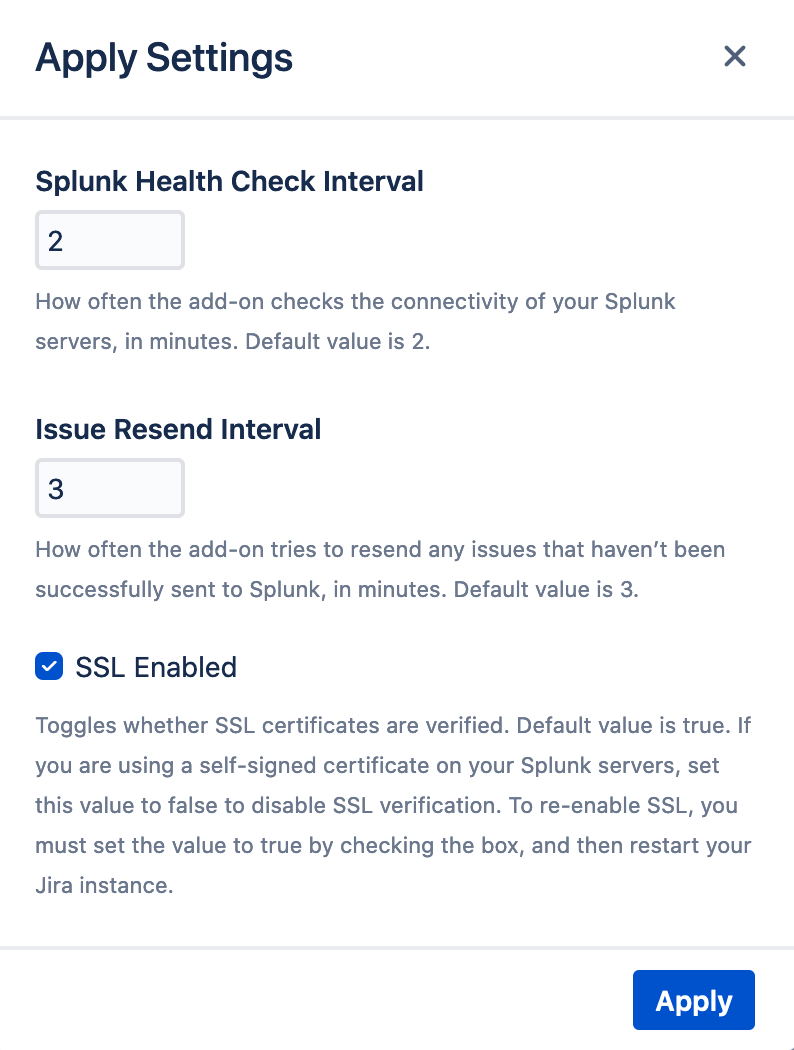
On the Settings page, configure the communication settings between Jira and Splunk.
Field Description Splunk Health Check Interval How often the add-on checks the connectivity of your Splunk servers, in minutes. Default value is 2.Issue Resend Interval How often the add-on tries to resend any issues that haven’t been successfully sent to Splunk, in minutes. Default value is 3.SSL Enabled Whether SSL certificates are verified. Default value is true. If you are using a self-signed certificate on your Splunk servers, set this value to false to disable SSL verification.- Click Apply.
Next Steps
If necessary, add, modify, or delete Splunk server connections in Jira.