Available Features in the Splunk App for Jira Server
Splunk Features
| Item | Description |
|---|---|
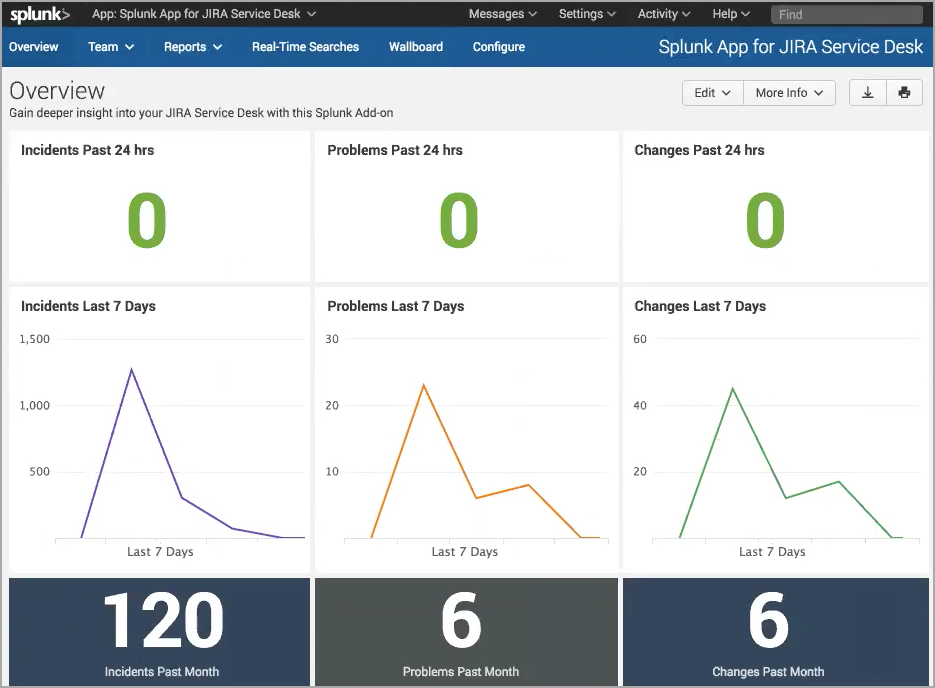
| Overview | Operational health status indicator and summary of the incidents, problems, and changes across your IT environment. |
| Teams | Series of configurable reports for analyzing team-based and individual workload metrics. |
| Reports | Series of configurable reports for analyzing IT Service Desk and IT Ops data in detail. |
| Search | List of Splunk saved searches that are in the app context. The app includes several pre-configured searches for gaining insight into Jira ticket data that you can enable or disable. You can also configure Splunk to automatically open tickets in Jira for alerts on any saved searches. |
| Wallboard | Dashboard view of your JSD data that is well-suited to a large NOC monitor display. |
| Configure | Settings to manage the connection between Splunk and Jira. |
, multiple selections available, Use left or right arrow keys to navigate selected items