Configuring the JIRA Service Desk Server Add-On
On this page:
Related pages:
Prerequisites
- Server version of JSD.
- Administrator access to JSD and Splunk.
Installing the Splunk App
- Log in to your Splunk server as an admin.
- Install the JIRA Service Desk Add-on for Splunk app and restart Splunk.
- Go to Settings > Data Inputs > HTTP Event Collector > Global Settings.
- Beside All Tokens, click Enabled.
This setting enables the HTTP Event Collector (HEC) for your Splunk server. - Go to Settings > Data Inputs, and click HTTP Event Collector.
- Click Add new, and complete the following fields.
- Name — enter a descriptive name, such as
JSD Event Collector. - Source type — select
atlassian:jiraservicedesk:ticket:json. - Index — select the indexes where you want to send events. The recommended index is
main. - Ensure the Enable indexer acknowledgement check box is not selected.
- Name — enter a descriptive name, such as
- Click Review, and then click Submit.
- Locate the event collector you created, and obtain the URL and security token for it.
You will use this information to set up the connection to Splunk in JSD. - Repeat steps 1 – 9 for every Splunk server you want to connect to JSD.
Installing the JSD Add-On
Log in to your JSD instance as an admin.
Click the gear icon, and then click Add-ons.
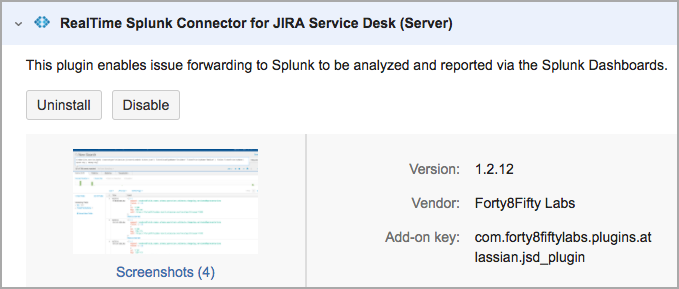
Search the Marketplace for Forty8Fifty Real-Time Splunk Connector for JIRA Service Desk.
Follow the on-screen instructions to buy the add-on or start the free trial for 30 days.
Using the Setup Wizard
Use the setup wizard to connect a Splunk server, configure a registration between JSD projects and the Splunk server, and send historical JSD ticket data to Splunk.
- In JSD, click the gear icon, and then click Applications.
- Under Integrations, click RealTime Splunk Connector for JIRA.
- Click Setup Wizard.
On the Create a Splunk page, enter the connection details for the Splunk server where you want to send issues.
Field Description Name User-friendly name for this Splunk server connection in Jira. For example:
Acme-EAST.URL URL to the base Splunk server with the API port in the format:
https://<host>:<port>For example:
https://splunk.acme.com:8088Token Splunk security token to use in the authorization header. You can find this once you create
your HTTP event collector in Splunk. For example:
ABA2EE20-8516-45B7082210F0A5D4610D88.Click Save Splunk.
Alternatively, click Skip. You can add Splunk servers to JSD later.- On the Create a Registration page, associate specific projects in JSD with the Splunk server and determine when to automatically send issues.
Field Description Projects Add any combination of projects for which you want to send issues to a Splunk server.
Splunks Add any combination of Splunk servers to receive issues from the selected projects. Events Select which events will trigger the add-on to automatically send Jira data to the Splunk servers. For example, if you want Jira to send data to the selected Splunk servers whenever an issue in one of the selected projects is updated, select the Issue Updated check box. Click Save Registration.
Alternatively, click Skip. You can add registrations later.
